
Chart Generator
Generate professional charts and data visualizations directly from your AI agent. Turn raw data, spreadsheets, reports, or natural language prompts into publication-ready charts in seconds.
The Chart Generator enables your AI agent to automatically create high-quality charts from structured data or natural language instructions. Whether you're visualizing business metrics, financial reports, survey results, or research data, AgentX generates clear and professional charts ready to use in presentations, reports, and documents.
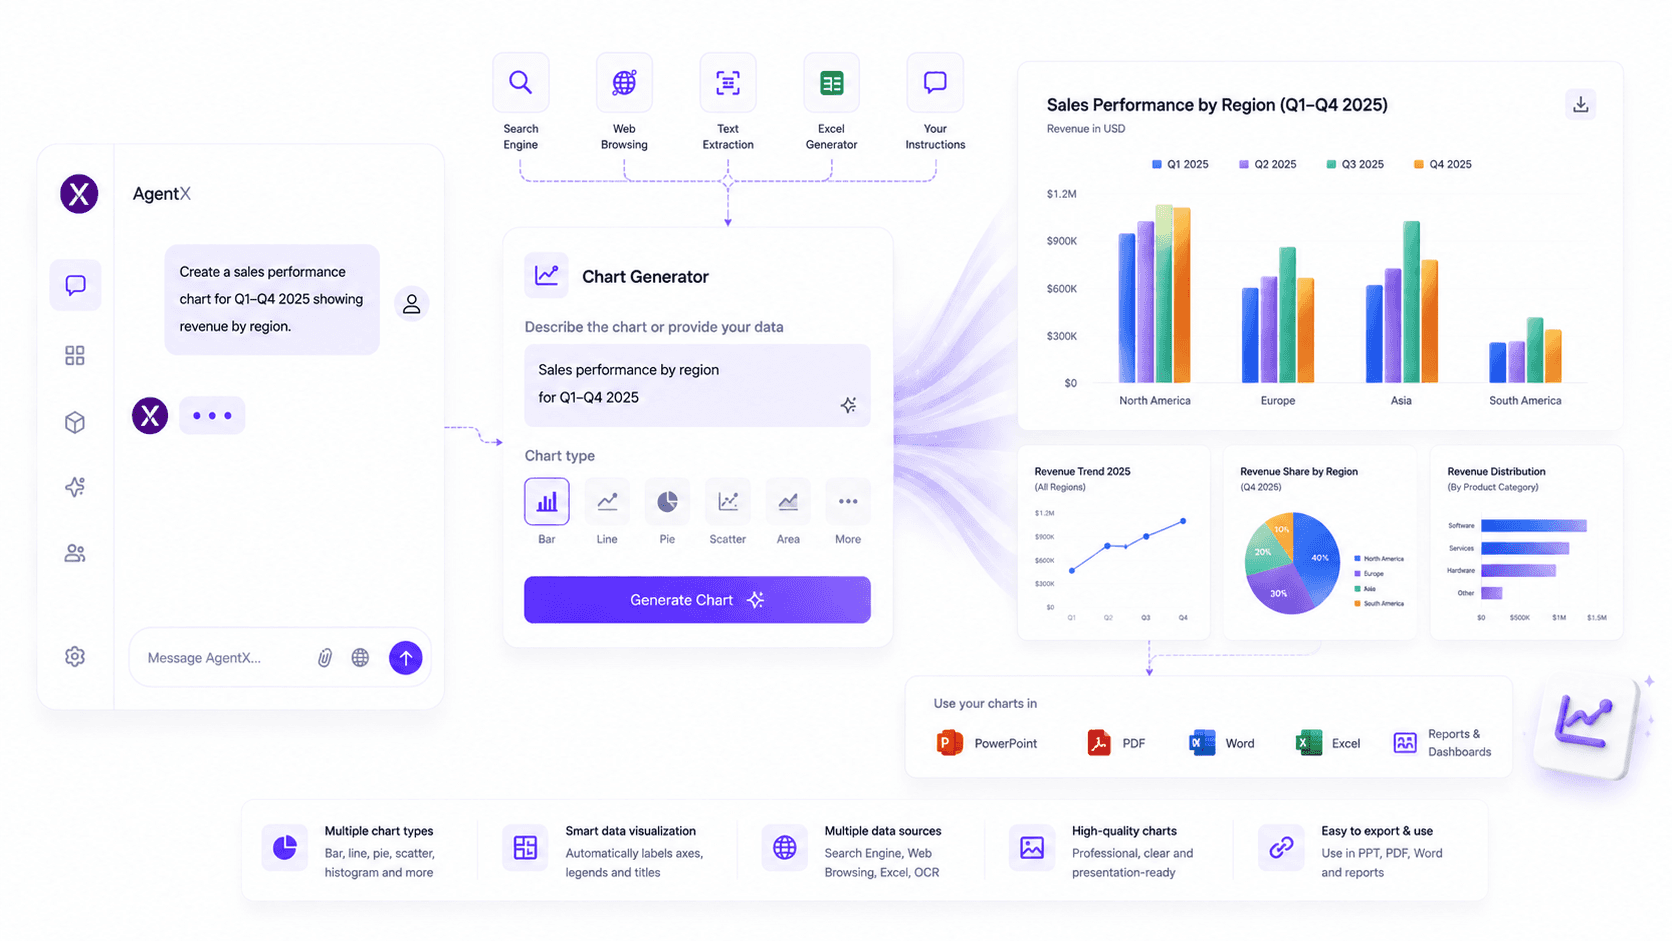
Features
The Chart Generator enables your AI agent to:
Generate professional charts from structured data
Create visualizations directly from natural language prompts
Support multiple chart types including bar, line, pie, scatter, histogram, and more
Visualize data from spreadsheets, reports, and AI-generated datasets
Automatically label axes, legends, and titles
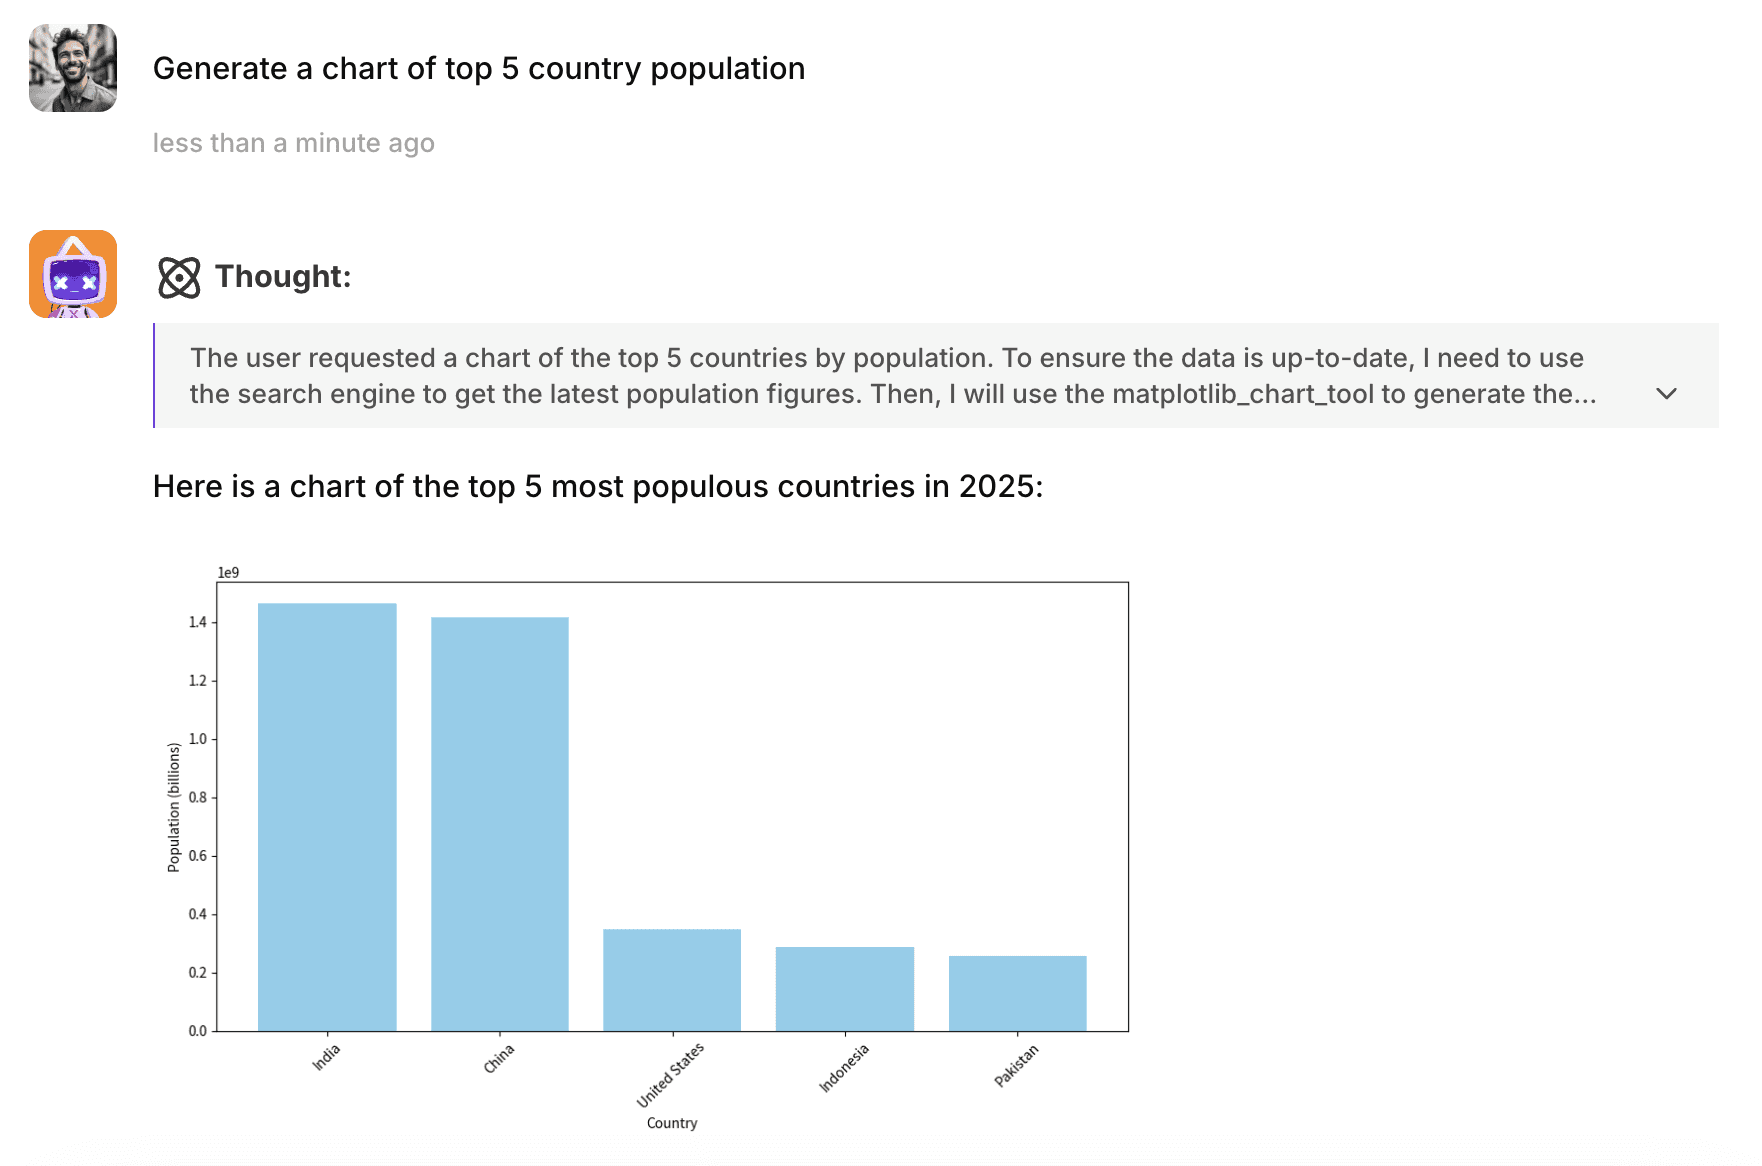
Generate charts from information collected using Search Engine
Visualize data extracted with Text Extraction
Export charts for use in PowerPoint, PDF, and Word documents
Combine with Excel Generator to generate both spreadsheets and visualizations from the same dataset
How to use
Create or edit your AI agent.
Ask your AI agent to create a chart from your data or describe the visualization you need.
Your agent will automatically generate a downloadable chart image ready for use in reports, presentations, or documents.
💡 New to AgentX? Learn how to build AI-powered reporting workflows in our AI Agent Tutorial.
Best practices
Provide structured data whenever possible for the most accurate visualizations.
Specify the chart type if you have a preference (bar, line, pie, scatter, histogram, etc.).
Include axis labels, units, and titles if they're important for your audience.
Combine Search Engine with Chart Generator to visualize the latest publicly available data.
Use Text Extraction to extract tables from PDFs or scanned reports before generating charts.
Combine with Excel Generator, PowerPoint Generator, or PDF Generator to create complete business reports with data visualizations.
Common use cases
Chart Generator is perfect for creating:
Business dashboards
Sales charts
Revenue reports
Financial visualizations
KPI dashboards
Survey results
Research charts
Marketing analytics
Population and demographic charts
Scientific data visualizations
AI-generated business reports
FAQ
What types of charts are supported?
Your AI agent can generate a wide range of chart types, including bar charts, line charts, pie charts, scatter plots, histograms, and other common business and analytical visualizations.
Can Chart Generator use live data?
Yes. Combine Search Engine with Chart Generator to visualize up-to-date information retrieved from the web.
Can I generate charts from Excel files or PDFs?
Absolutely. Use Text Extraction to extract tables from uploaded PDFs or images, or use Excel Generator to organize your data before creating charts.
Can I use generated charts in presentations?
Yes. Generated charts can be included in presentations created with PowerPoint Generator, reports generated by PDF Generator, or documents created with Word Generator.
🚀 Ready to visualize your data?
Enable Chart Generator and let your AI agent transform raw data into clear, professional charts for reports, presentations, and business analysis.